If you grew up as a space-junkie kid like me, then you've probably been watching the news for the past few days, wondering when and where China's Tiangong 1 space station was going to fall out of orbit, and crash to Earth. According to Popular Mechanics (PM), that happened at 8:16pm EDT, April 1, 2018. I would have loved to have the data and knowledge to try to predict the event ... but I guess the next best thing (for a Graph Guy) is to plot the data after-the-fact!
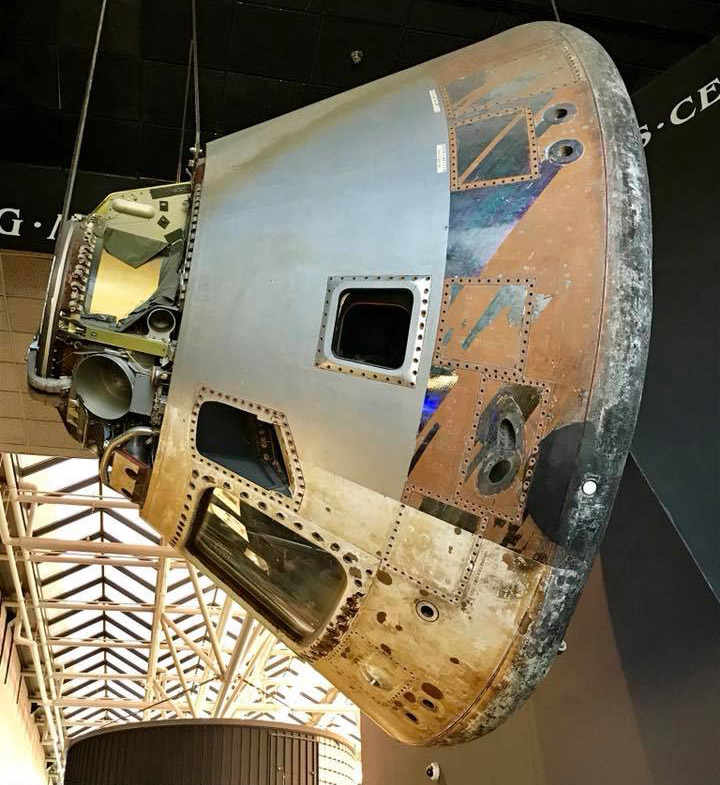
But before we get into the data visualization, here's a picture to get you into the mood ... This is a picture of a space capsule, from my buddy Mark. Do you recognize which capsule it is, or where it's located?
Now, let's analyze that Tiangong 1 data! ...
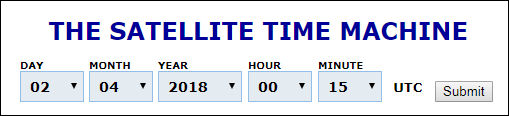
After a bit of Google searching, I found a web page that lets you enter a date/time, and it shows you the locations of all the satellites. So I entered the date/time right before the PM article said the space station reentered:
Which produced the following map. I moused over each satellite until I found the Tiangong 1 (which I've circled in yellow in the screen-capture below). I clicked on that satellite icon, and then the data for Tiangong 1 was displayed at the top of the table below the map (I've also circled that in yellow, to make it easier for you to find).
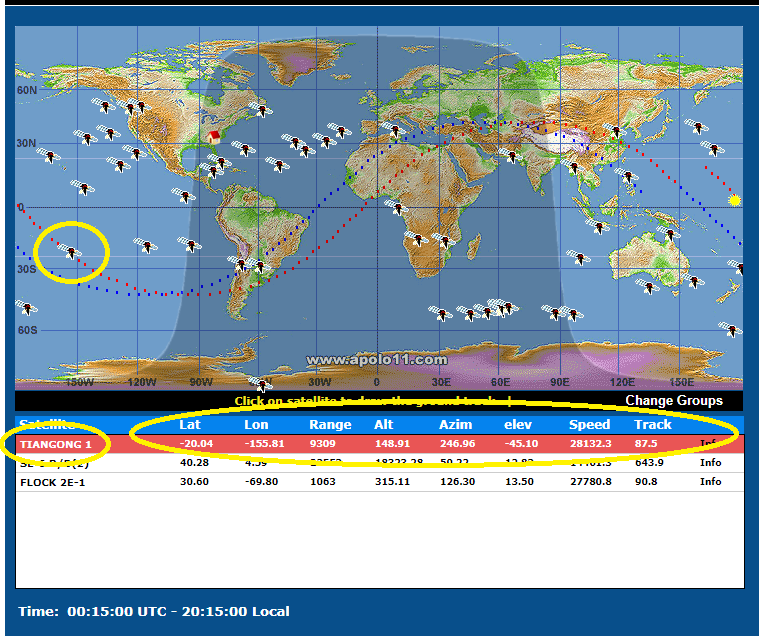
And now the tedious part. I copy-n-pasted the line of data into a text file ... and then repeated this process (select a date/time, find the satellite, click on it, and copy-n-paste the data) for each 5-minute increment, until I had all the data points for the last orbit around the Earth before the satellite reentered. Sometimes getting the data takes more time than plotting it!
And here's my final plot of the data. If you click the image below, you'll see the interactive version, with mouse-over text for each arrow-head, showing the date/time when it was at that location (something the original map did not have!)
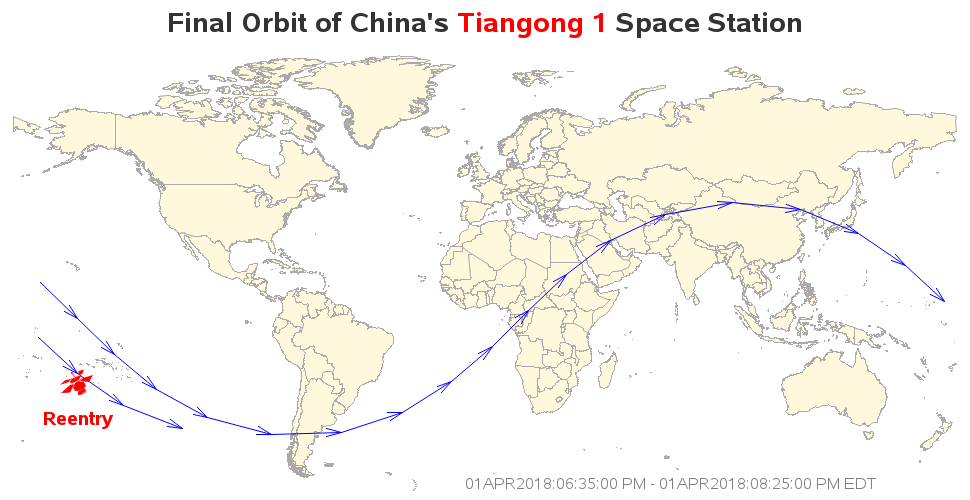
Technical programming details:
- I used the annotate arrow function to draw the arrows (so you can easily tell what direction it was moving).
- I used character '6b'x of the Windows Webdings font to plot the image of a satellite (approximately where it reentered).
- I used the TZONEU2S() function to convert the UTC data/timestamps to EDT (the time zone I live in).
- When I projected the world map, I saved the projection parameters in a dataset (using the new parmout= option), so that I could later project the satellite path coordinates with the same parameters (using the new parmin= option). This way, I didn't have to combine the map and satellite coordinates, project them together, and separate them.
OK you statisticians out there - what is the likelihood of being hit by a piece of (man-made) "space junk" falling from orbit?

1 Comment
people are making a big deal of the Chinese space junk . space junk falls from the sky every day the Chinese space station will be no different let's hope it fall in the ocean